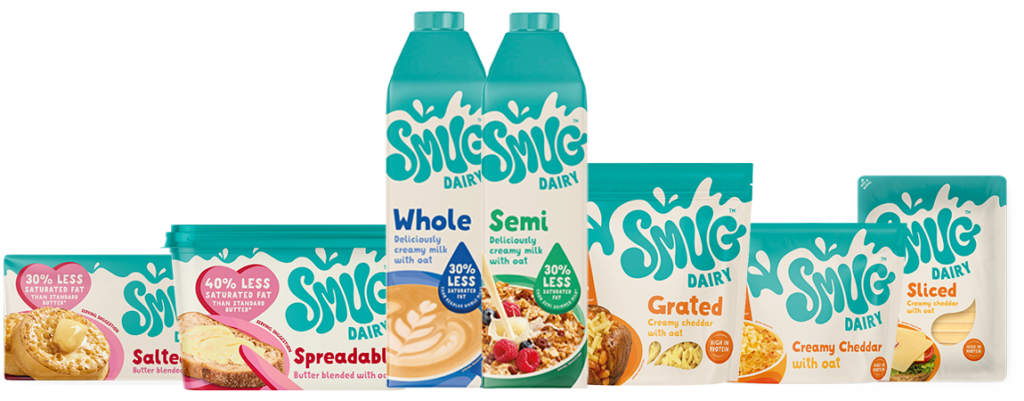
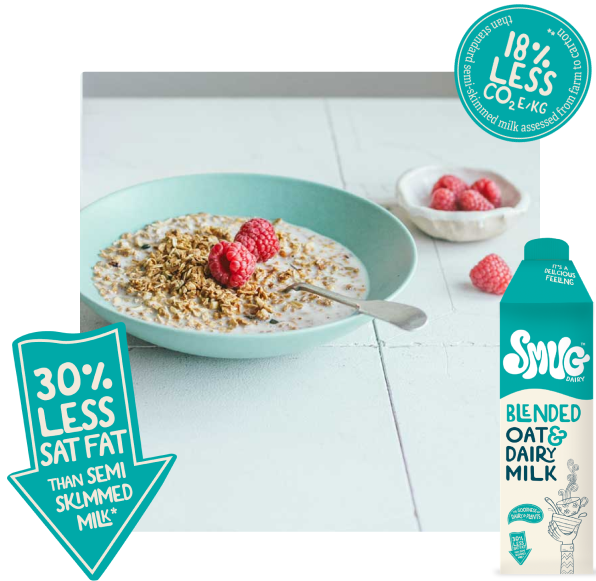
Well with Dairy lower in sat-fat* & CO2E** than standard butter milk or cheese, it’s dairy to feel smug about
*From 30% – 40% less saturated fat and from 18% to 54% less co2e/kg than than standard butter, semi skimmed milk and cheddar assessed from farm to pack | 2023 life cycle assessment: farm to pack comparing SMUG Dairy & standard equivalent
FEEL AS SMUG AS LARRY
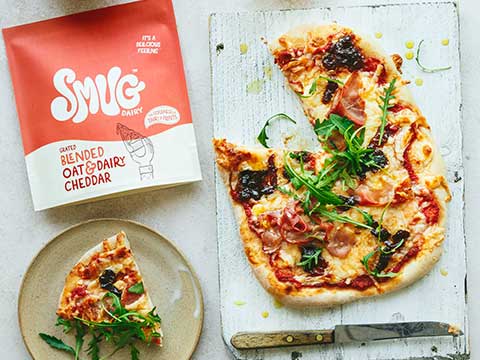
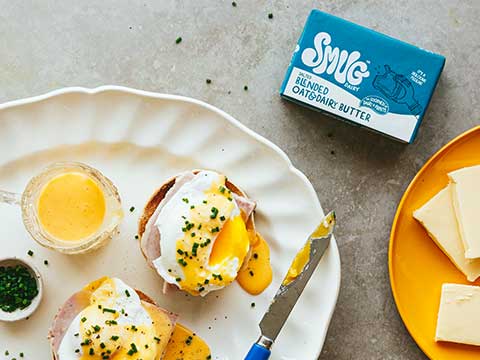
INDULGE IN A blend of dairy & oat
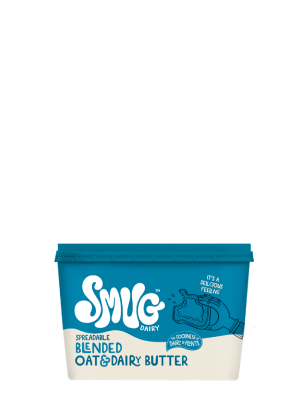
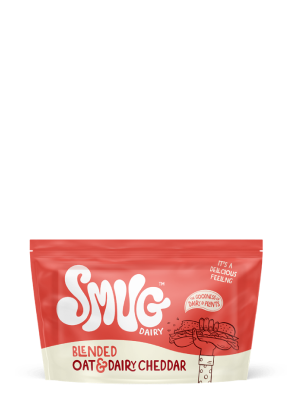
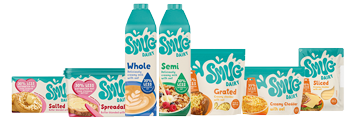
From butter to cheddar to barista-ready milk, we blend the taste you love with less fat and a lot more feel-good.
And here’s why.
We love Dairy!
It’s oozy, unctuous, creamy and one of life’s little pleasures. But we’re also aware it can cause quite the dilemma.
We’re here to remove some of that doubt, without making you feel like you have to be a
die-hard dairy lover or a plant based super fan.
We believe in choice!
The choice to indulge and still think about your health.
To indulge without feeling like you've picked a side
To eat a cheese toastie without getting
screamed at and covered in orange paint.
You could say we’re Bothists.
We say have your dairy and eat it too.
If that make us a little SMUG, so be it…
Smug Facts & Figures
Travel to AMSTERDAM
By choosing SMUG Spreadable Butter Blended with Oat for a year, a regular butter buyer could save 25.41kg of CO2e - equivalent to 391 train miles or a trip from London to Amsterdam with enough left for stroopwafels.*
Travel to PARIS
A regular butter buyer could save 21.84kg of CO2e per year by switching to SMUG Butter Blended with Oat - that's enough to travel 339 miles on a train, or from London to Paris (and over 30 smug miles back).*
WASHING POWER
Switching to SMUG Whole Milk with Oat could save a regular whole milk buyer 85.5kg of CO2e in a year - which is approximately enough energy to power a washing machine for up to 11 years, depending on how often you wash.*
MORE WASHING POWER
Choosing SMUG Semi-Skimmed Milk with Oat could save 53.2kg of CO2e per year - enough to power a washing machine for roughly 6.86 years. That's a lot of clean smug socks.
To see more indepth content about the above facts and figures and for full details of our methodology and calculation, click the button below!
*CO₂e savings are based on average annual UK consumer purchasing data from 2023 (Kantar) and cradle-to-manufacturing-gate Life Cycle Assessments independently conducted by HowGood.
Comparisons to lifestyle activities (e.g. train travel, appliance energy use) are approximate and based on publicly available UK carbon conversion factors from Rensmart.
Illustrative comparisons are estimates. Actual impact may vary depending on personal usage, energy sources and travel behaviours.